

RUDN University Mathematician Calculated the Most Effective Vaccination Strategy
Within different groups of the population — for example, age or social — the epidemic spreads in different ways. Therefore, the overall rate of spread of the disease depends on the ratio of such groups in the population. The RUDN University mathematician, together with colleagues from India, Romania and France, built a mathematical model and found out how many people need to be vaccinated and how best to vaccinate. The calculations were carried out in a generalized form, so the results can be useful not only in the conditions of any epidemic or pandemic, including COVID-19.
“We studied a two-group epidemic model. The groups differ in the rate of transmission of the disease. Infection, the maximum and total number of infected depends on the ratio between the groups. We considered various strategies for distributing the vaccinated between the two groups and calculated what would be their outcome”, – Doctor of Physical and Mathematical Sciences Vitaly Volpert, Director of the Interdisciplinary Research Center” Mathematical Modeling in Biomedicine “, RUDN University.
The model that mathematicians looked at describes two populations with different rates of infection and recovery. Mathematically, this model is expressed as a system of differential equations with four unknowns — the number of sick and healthy people in each of the two groups. The solution to these equations shows how many people in which group need to be vaccinated for the epidemic to subside. It is assumed that the vaccine itself is completely effective — after it it is impossible to get sick.
The results of the solution can be presented in the form of a graph — along the axes, the number of vaccinated in the first and second groups, and on the plane itself there is a closed figure: a triangle or a trapezoid. If the number of vaccinated in the first and second groups falls inside this figure, then the epidemic fades.
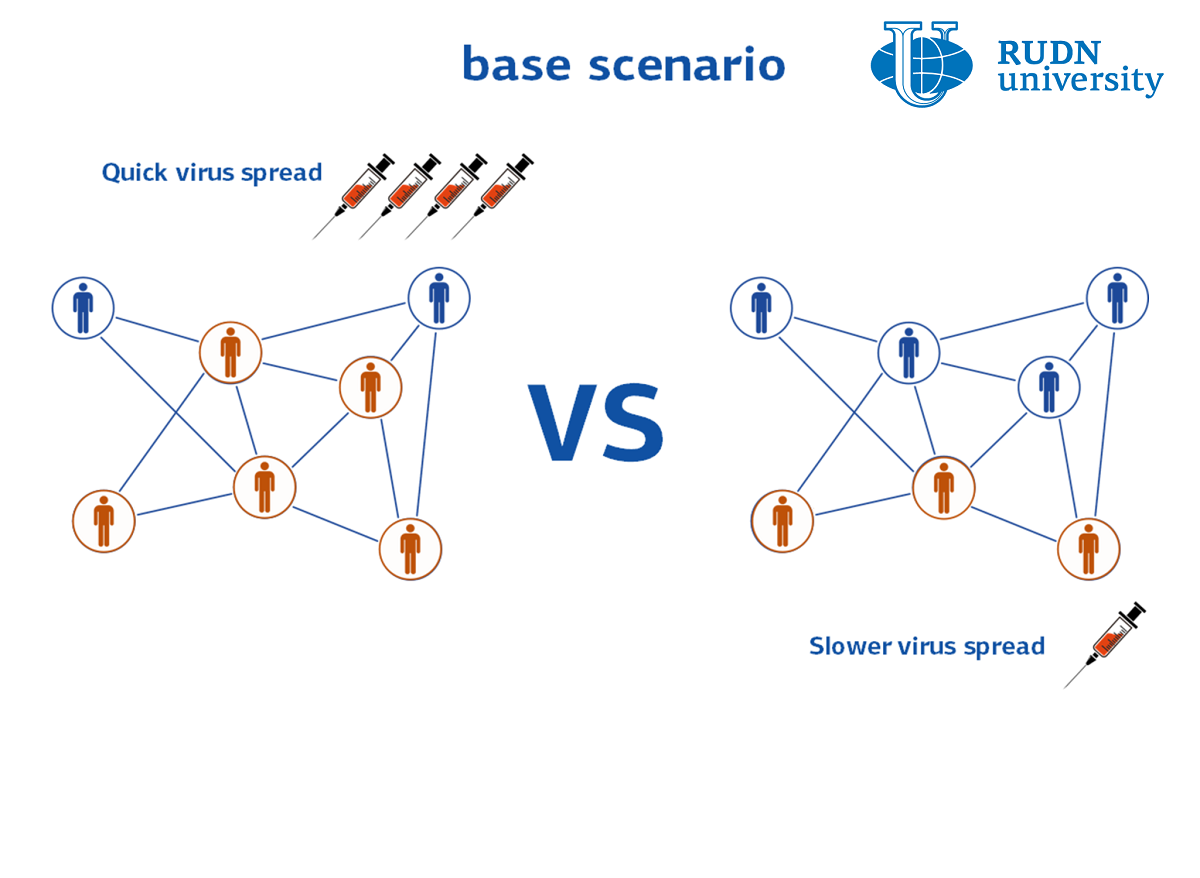
However, in real conditions, it is impossible to vaccinate the required number of people at once — vaccination is carried out in stages. This is due to both economic and social factors. In terms of mathematics, all these factors can be described in terms of the generalized “cost” of vaccination. To find out which vaccination strategy will be the most effective, the RUDN University mathematician solved the minimization problem — an integral equation that allows you to find the minimum of both the number of infected in each group and the cost of vaccination. Mathematicians tested four vaccination strategies. Each was carried out in five stages with the same total number of vaccines at each stage, but with a different ratio of vaccinated from the two groups. For all strategies, mathematicians determined how the total number of cases will change over time.
It turned out that the least effective strategy is “natural” when people for vaccination are randomly selected evenly among the entire population. The following strategy turned out to be the most effective: at the first three stages, vaccinate approximately the same number of people from the group with a low infection rate and increase the number of vaccinated people from the second group several times, and vice versa at stages 4 and 5. These results are valid in the general case. However, depending on the characteristics of a particular disease, for example, with different mortality rates for different age groups, as in the case of COVID-19, the situation is reversed.
“In general, vaccination of the second group is more effective in terms of minimizing the number of infected. This conclusion could be expected since the rate of disease transmission in this group is higher. However, this conclusion may not be correct given the mortality in the two groups. Taking COVID-19 as an example, if we assume that the mortality rate among people over 60 is 10 times higher, then the total number of deaths decreases with a greater proportion of vaccinated in the first group, even though the infection rate in it is lower,”- Dr. of Mathematical Sciences Vitaly Volpert, Director of the Interdisciplinary Scientific Center “Mathematical Modeling in Biomedicine” RUDN.
The results are published in the journal Applied Mathematics Letters. https://www.sciencedirect.com/science/article/abs/pii/S0893965921000987
RUDN summarized the results of the scientific competition "Project Start: work of the science club ". Students of the Faculty of Physics, Mathematics and Natural Sciences have created a project for a managed queuing system using a neural network to redistribute resources between 5G segments. How to increase flexibility, make the network fast and inexpensive and reach more users — tell Gebrial Ibram Esam Zekri ("Fundamental Computer Science and Information Technology", Master's degree, II course) and Ksenia Leontieva ("Applied Mathematics and Computer Science", Master's degree, I course).
The National Demographic Report, 2023 Demographic Well-Being of Russian Regions (hereinafter - the National Demographic Report) was prepared by the scientific team of the Institute of Demographic Studies of the Federal Research Center of the Russian Academy of Sciences, the Vologda Scientific Center of the Russian Academy of Sciences, Peoples' Friendship University of Russia, the Center for Family and Demography of the Academy of Sciences of the Republic of Tatarstan, as well as with the participation of leading scientists from the Republic of Bashkortostan, Stavropol Krai, Volgograd, Ivanovo, Kaliningrad, Nizhny Novgorod, Sverdlovsk Oblasts and Khanty-Mansi Autonomous Okrug–Yugra.
RUDN summarized the results of the scientific competition "Project Start: work of the science club ". Students of the Faculty of Physics, Mathematics and Natural Sciences have created a project for a managed queuing system using a neural network to redistribute resources between 5G segments. How to increase flexibility, make the network fast and inexpensive and reach more users — tell Gebrial Ibram Esam Zekri ("Fundamental Computer Science and Information Technology", Master's degree, II course) and Ksenia Leontieva ("Applied Mathematics and Computer Science", Master's degree, I course).
What is your first association with the word “laboratory”? Flasks and beakers? Microscopes and centrifuges? Yes, many of us would answer the same way.
The National Demographic Report, 2023 Demographic Well-Being of Russian Regions (hereinafter - the National Demographic Report) was prepared by the scientific team of the Institute of Demographic Studies of the Federal Research Center of the Russian Academy of Sciences, the Vologda Scientific Center of the Russian Academy of Sciences, Peoples' Friendship University of Russia, the Center for Family and Demography of the Academy of Sciences of the Republic of Tatarstan, as well as with the participation of leading scientists from the Republic of Bashkortostan, Stavropol Krai, Volgograd, Ivanovo, Kaliningrad, Nizhny Novgorod, Sverdlovsk Oblasts and Khanty-Mansi Autonomous Okrug–Yugra.